AARP Hearing Center
Between 2010 and 2019, drivers in the United States struck and killed 53,435 pedestrians — more than 14 people per day on average.
- Older adults, people of color and individuals in low-income communities are disproportionately represented in fatal crashes involving pedestrians.
The reasons for the high rates, which have increased every year over the past decade, are many, ranging from public policy and traffic engineering decisions, to the elevated heights of trucks and some passenger vehicles, to the way the nation's roadways are designed and constructed.
- People between ages 50 and 65, and people over 75, are overrepresented in pedestrian fatalities caused by vehicles.
"Our approach to building and operating streets and roads is directly contributing to these deaths," note the authors of Dangerous By Design 2021, a report by Smart Growth America and its National Complete Streets Coalition initiative. "We continue to design streets that are dangerous for all people."
- The rates at which pedestrians are struck and killed by vehicles per 100,000 people: 1.6 (in urban areas), 1.7 (in rural areas)
The following illustrations are featured in the report to show the differences in a street that prioritizes the desire to keep vehicles moving — fast — compared to one that's safer for all users.
Dangerous By Design

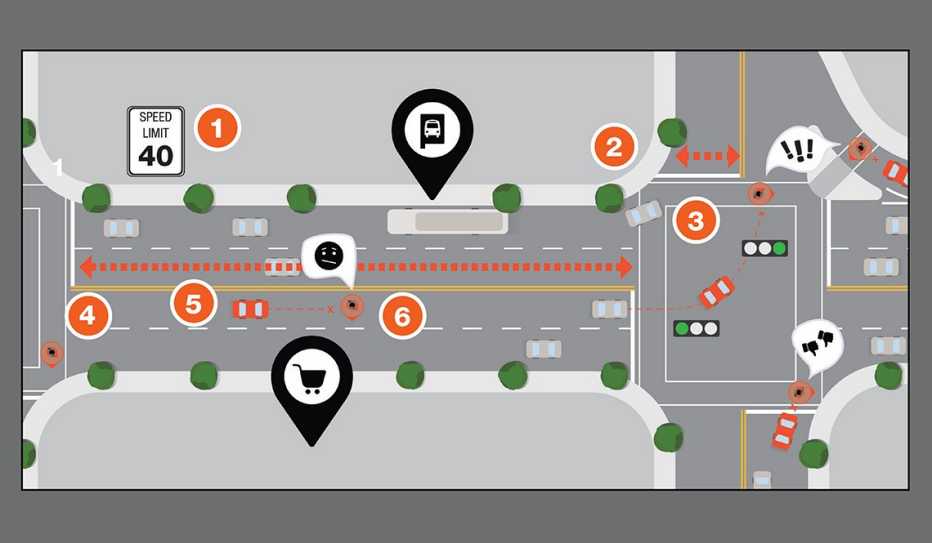
Designing roads for high speeds dramatically increases the likelihood that a pedestrian stuck by a vehicle will be killed. For instance, at 40 miles per hour, 85 percent of crashes involving a person who is walking are fatal. (The numbers on the illustration correspond to the information below.)
- Speed is the number one factor in pedestrian fatalities
- Streets with wide lanes encourage faster driving, regardless of the posted speed limit
- "Slip" lanes were designed to keep vehicles from needing to slow down when making right-hand turns
- Streets with wide corners create long crossing distances for pedestrians
- Long distances between intersections encourage faster driving speeds
- Streets without properly placed crosswalks leave pedestrians with the choice of either crossing unsafely or walking far out of their way to cross, especially when destinations are located directly opposite one another
Safer By Design

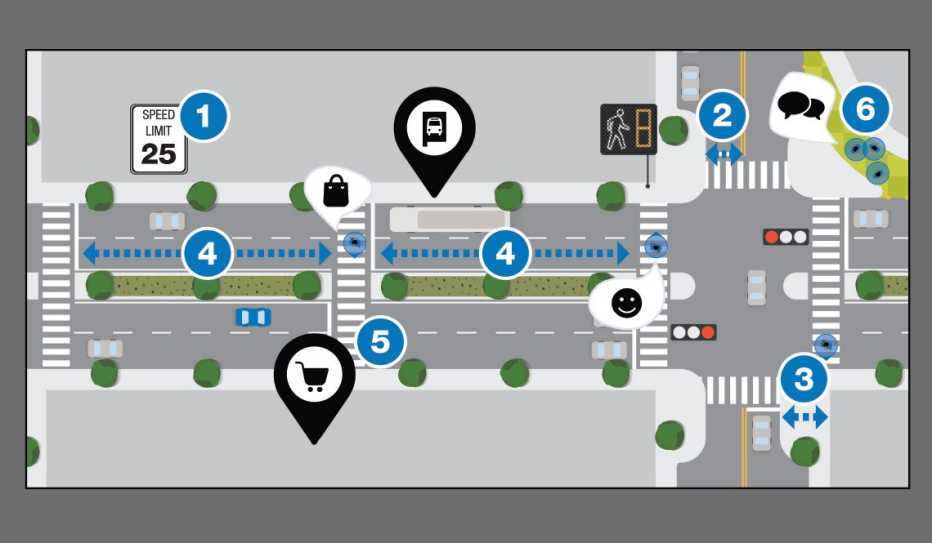
A roadway that's designed for all users is often referred to as a "Complete Street." (Check out the link below to see a close-up example of one.)
- While it's important to lower speed limits, safe design provides drivers with added visual cues to slow down
- Narrow travel lanes naturally slow traffic
- Highly visible, signalized crosswalks make drivers more aware of pedestrians, and extended curbs shorten the distance required to cross the street
- Decreasing the distance between intersections helps to reduce speeds
- Adding signalized crosswalks in the middle of long blocks slows traffic and provides connections where people need or want to cross
- Eliminating right turn "slip" lanes in favor of right-angle corners produces slower, safer turns and shorter crossing distances for pedestrians
Learn More
- See a slideshow of Dangerously Incomplete Streets
- See an example of a Complete Street
- Find AARP resources: Complete Streets, Transportation, Walking, Bicycling
- Learn more from Smart Growth America
Data from Dangerous by Design 2021 | Page published March 2021


