AARP Hearing Center
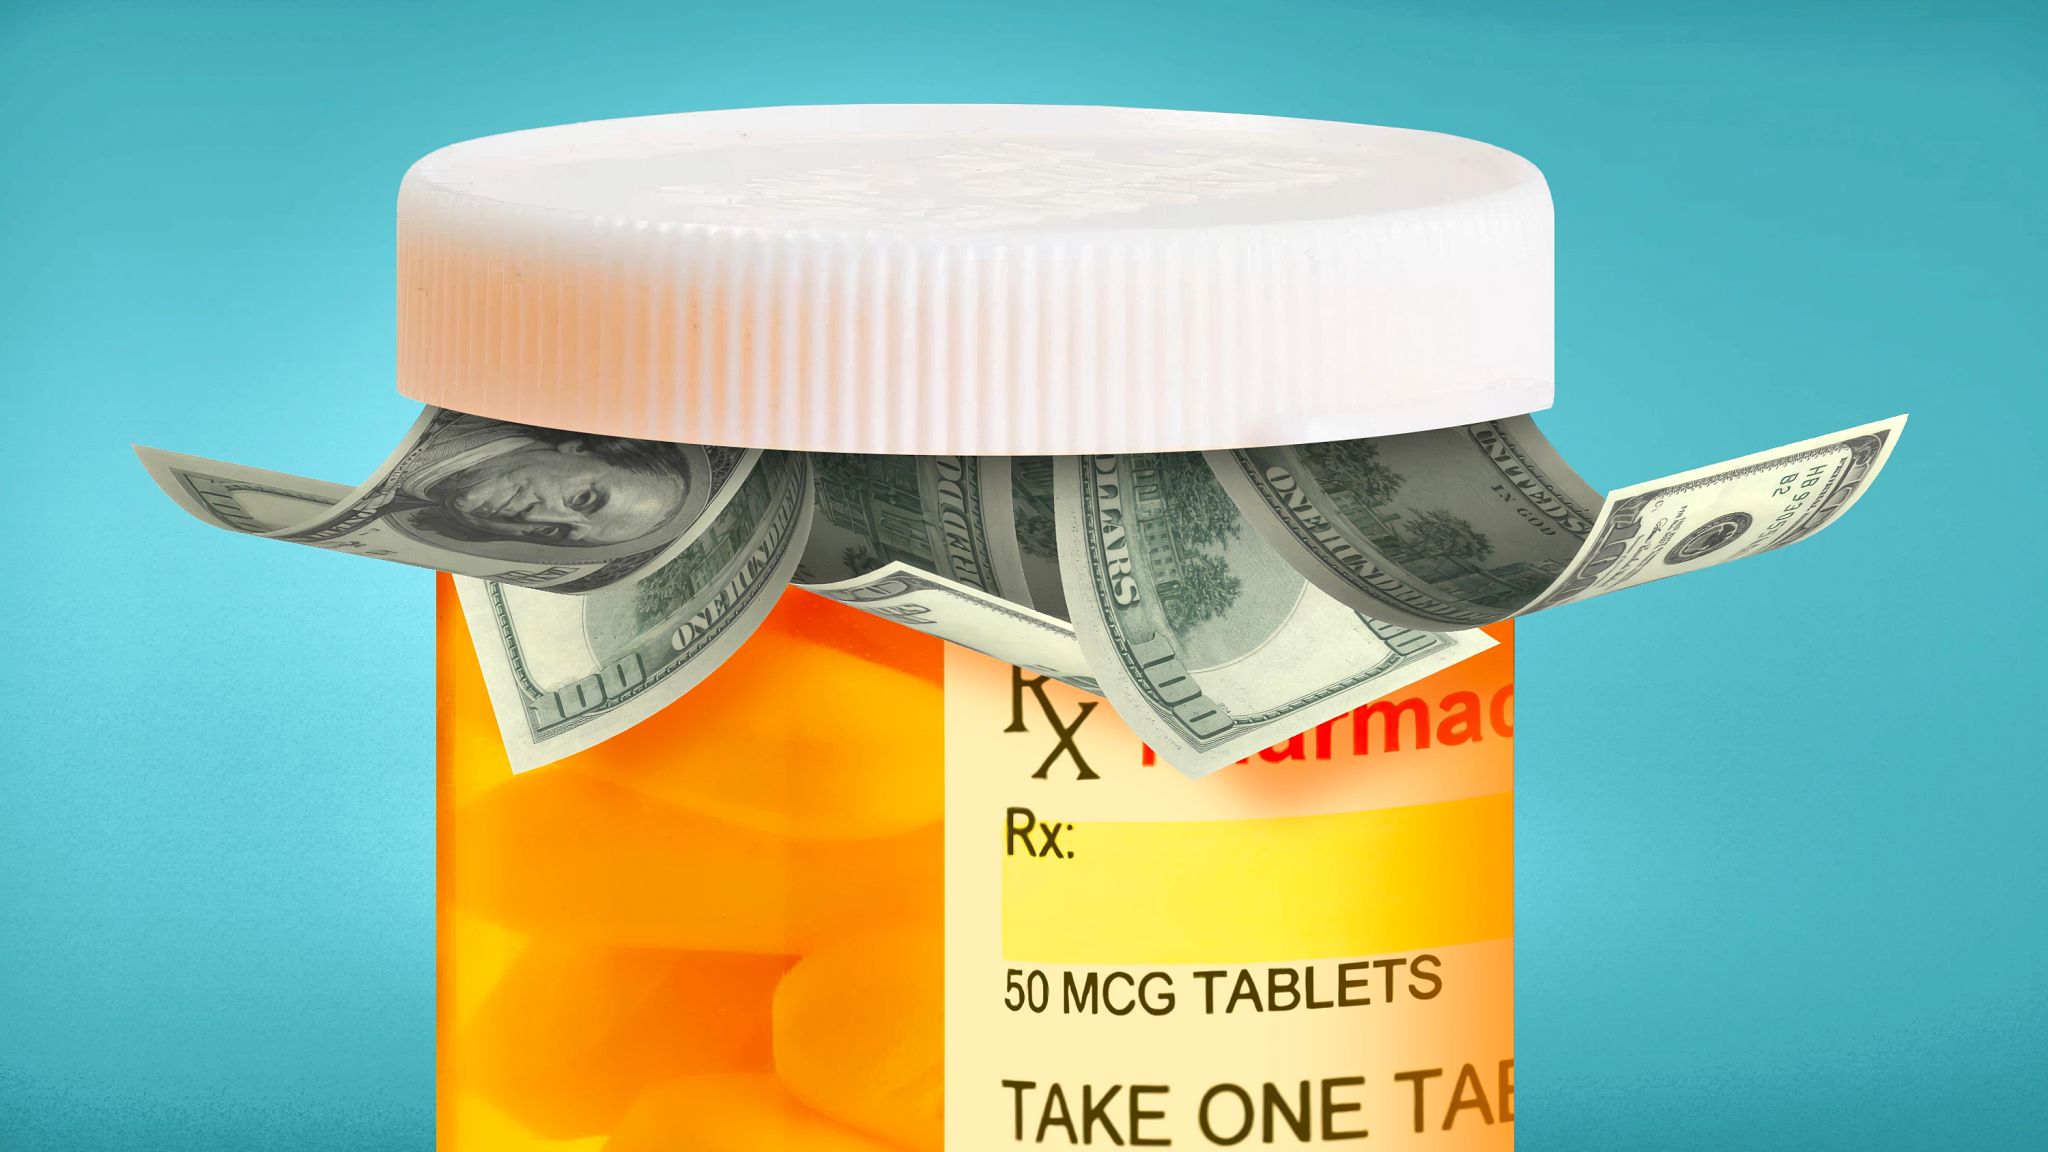
Prescription drug price increases affect consumers, employers, private insurers, and taxpayers who fund programs like Medicare and Medicaid. Spending increases driven by high and growing drug prices will eventually affect all Americans in some way. Those with private health insurance will pay higher premiums and cost sharing for their health care coverage. Over time, it could also lead to higher taxes and/or cuts to public programs to accommodate increased government spending.
Key Findings
In 2024, retail prices increased for three-quarters of the widely used brand name prescription drugs included in the AARP’s latest Rx Price Watch report. However, retail prices decreased overall, largely due to inhaler and insulin products with outlier price decreases. This is the first time that the overall brand name price trend has declined in the 20-year history of the AARP Public Policy Institute’s Rx Price Watch series and likely reflects a confluence of factors, including voluntary drug manufacturer commitments to reduce prices and ongoing state and federal efforts to address high prescription drug prices. Read the full report.
- Retail prices for 253 widely used brand name drugs decreased overall by an average of 1.4 percent, largely due to inhaler and insulin products with outlier price decreases.
- In contrast, the general inflation rate was 3.0 percent over the same period
- The average annual cost for one brand name medication was nearly $13,000 in 2024, more than seven times higher than the average annual cost of therapy in 2006, the year Medicare implemented the Part D program.
- For the average older American taking four and a half prescription drugs per month, the annual cost of therapy would have been more than $58,000 in 2024.
- This amount exceeds the median annual income of Medicare beneficiaries ($43,200) by more than 30 percent.
- If retail price changes had moved with general inflation between 2006 and 2024, the average annual cost of drug therapy for one brand name drug used on a chronic basis would have been almost $10,000 lower in 2024 ($2,764 vs. $12,962).
This report is the latest in the AARP Public Policy Institute’s Rx Price Watch series. Separate reports analyze price changes for widely used generic and specialty drug products. The series also analyzes the price changes for an overall market basket (i.e., brand name, generic, and specialty drug products combined) to reflect the overall market impact of drug price changes.
Previous Reports
2023
- Trends in Retail Prices of Generic Prescription Drugs Widely Used by Older Americans, 2006 to 2020 (PDF)
- Prices for Widely Used Generic Drugs Increase Slightly in 2020 after Four Years of Substantial Price Drops (PDF)
2021
- Trends in Retail Prices of Specialty Prescription Drugs Widely Used by Older Americans, 2006 to 2020 (PDF)
- Specialty Prescription Drug Prices Continue to Climb (PDF)
- Rx Price Watch Report: Trends in Retail Prices of Brand Name Prescription Drugs Widely Used by Older Americans, 2006 to 2020 (PDF)
- One-Pager: Brand Name Prescription Drug Prices Increase Over Twice as Fast as Inflation in 2020 (PDF)
2019
- Brand Name Drug Prices Increase More than Twice as Fast as Inflation in 2018 (PDF)
- Trends in Retail Prices of Prescription Drugs Widely Used by Older Americans, 2017 Year-End Update (PDF)
- One-Pager: Price Growth for Brand Name and Specialty Drugs More Than Offset Price Decreases for Generic Drugs (PDF)
- Trends in Retail Prices of Specialty Prescription Drugs Widely Used by Older Americans: 2017 Year-End Update (PDF)
- One-Pager: Specialty Prescription Drug Prices Continue to Climb (PDF)
- One-Pager: Price Decreases for Widely Used Generic Drugs Slow in 2017 after Two Years of Substantial Price Drops (PDF)
- Trends in Retail Prices of Generic Prescription Drugs Widely Used by Older Americans: 2017 Year-End Update (PDF)
2018
- Trends in Retail Prices of Brand Name Prescription Drugs Widely Used by Older Americans 2017 Year-End-Update (Full Report, Sept 2018, PDF)
- One-Pager: Brand Name Prescription Drug Prices Increase Four Times Faster than Inflation in 2017 (Sept 2018, PDF)
2017
- Trends in Retail Prices of Prescription Drugs Widely Used by Older Americans 2006 to 2015 (Full Report, Dec 2017, PDF)
- One-Pager: Price Growth for Brand Name and Specialty Drugs More Than Offset Price Decreases for Generic Drugs (Dec 2017, PDF)
- Trends in Retail Prices of Specialty Prescription Drugs Widely Used by Older Americans 2006 to 2015 (Full Report, Sept 2017, PDF)
- One-Pager: Specialty Prescription Drug Prices Continue to Climb (Sept 2017, PDF)
- Trends in Retail Prices of Generic Prescription Drugs Widely Used by Older Americans, 2006 to 2015 (Full Report, Sept 2017, PDF)
- One-Pager: Prices of Widely Used Generic Drugs Drop Substantially in 2015 after Two Years of Price Increases (Sept 2017, PDF)
2016
- Trends in Retail Prices of Brand Name Prescription Drugs Widely Used by Older Americans, 2006 to 2015 (Full Report, Dec 2016, PDF)
- Brand Name Prescription Drug Prices Increase by Double-Digit Percentage for Fourth Straight Year (One-Page Summary, Dec 2016, PDF)
- Trends in Retail Prices of Prescription Drugs Widely Used by Older Americans, 2006 to 2013 (Full Report, Feb 2016, PDF)
- Price Growth for Brand Name and Specialty Drugs More Than Offset Substantial Price Decreases for Generic Drugs (One-Page Summary, Feb 2016, PDF)
2015
- Trends in Retail Prices of Specialty Prescription Drugs Widely Used by Older Americans, 2006 to 2013 (Full Report, Nov 2015, PDF)
- Trends in Retail Prices of Generic Prescription Drugs Widely Used by Older Americans, 2006 to 2013 (Full Report, May 2015, PDF)
- Trends in Retail Prices of Brand Name Prescription Drugs Widely Used by Older Americans 2006 to 2013 (Full Report, Nov 2014, PDF)
- Rx Price Watch Case Study: Efforts to Reduce the Impact of Generic Competition for Lipitor (Full Report, June 2013, PDF)
- Trends in Retail Prices of Prescription Drugs Widely Used by Medicare Beneficiaries 2005 to 2009 (Full Report, March 2012, PDF)
- Trends in Retail Prices of Specialty Prescription Drugs Widely Used by Medicare Beneficiaries 2005 to 2009 (Full Report, Jan 2012, PDF)
- Trends in Retail Prices of Generic Prescription Drugs Widely Used by Medicare Beneficiaries 2005 to 2009 (Full Report, July 2011, PDF)
- Trends in Retail Prices of Prescription Drugs Widely Used by Medicare Beneficiaries (Full Report, March 2011, PDF)
- Trends in Retail Prices of Brand Name Prescription Drugs Widely Used by Medicare Beneficiaries 2005 to 2009 (Full Report, Aug 2010, PDF)


